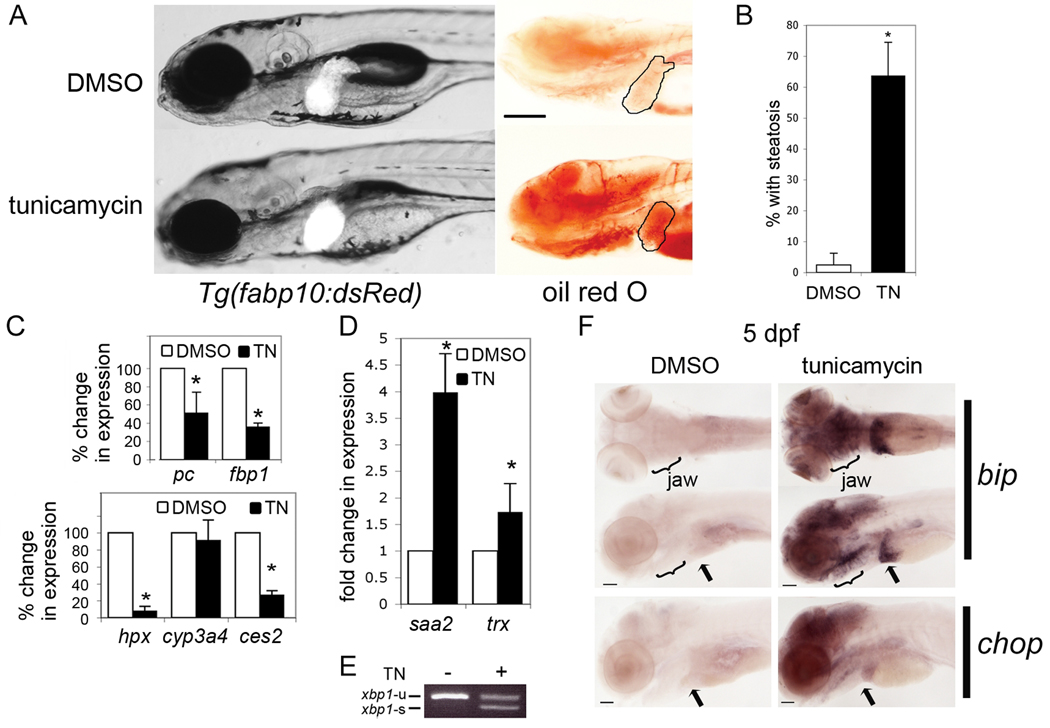
Figure 3. Tunicamycin causes steatosis and liver damage.
A. Tg(fabp10:dsRed) larvae exposed from 3–5 dpf to DMSO as a control or to 1µg/ml tunicamycin (TN) were imaged on 5 dpf live (left) or after whole mount staining with oil red O (right). The liver is circled. Scale bar = 200 µm. B. Tunicamycin treatment significantly increased the average percent of larvae with steatosis (6 clutches with n>100 for each sample; * p<0.0001 by Students t-test). Error bars represent standard deviation. Expression of genes implicated in liver function (C) and damage (D) was detected by qPCR in tunicamycin-treated embryos and normalized to controls (DMSO treated). Values represent the average fold change in 3 experiments; error bars indicate standard deviation. * indicates p<0.05 by a 1 sample t-test. E. xbp1-u and xbp1-s mRNA was detected in 5 dpf larvae treated for 48 hours with DMSO (−) or tunicamycin (+). Image is representative of 5 experiments. F. In situ hybridization of 5 dpf larvae to detect bip and chop. bip stained larvae are visualized from the ventral (top) and left lateral view (bottom) to show the jaw, pancreas and liver (arrow). Scale bar = 200 µm. Images are representative of 20 larvae per sample.

