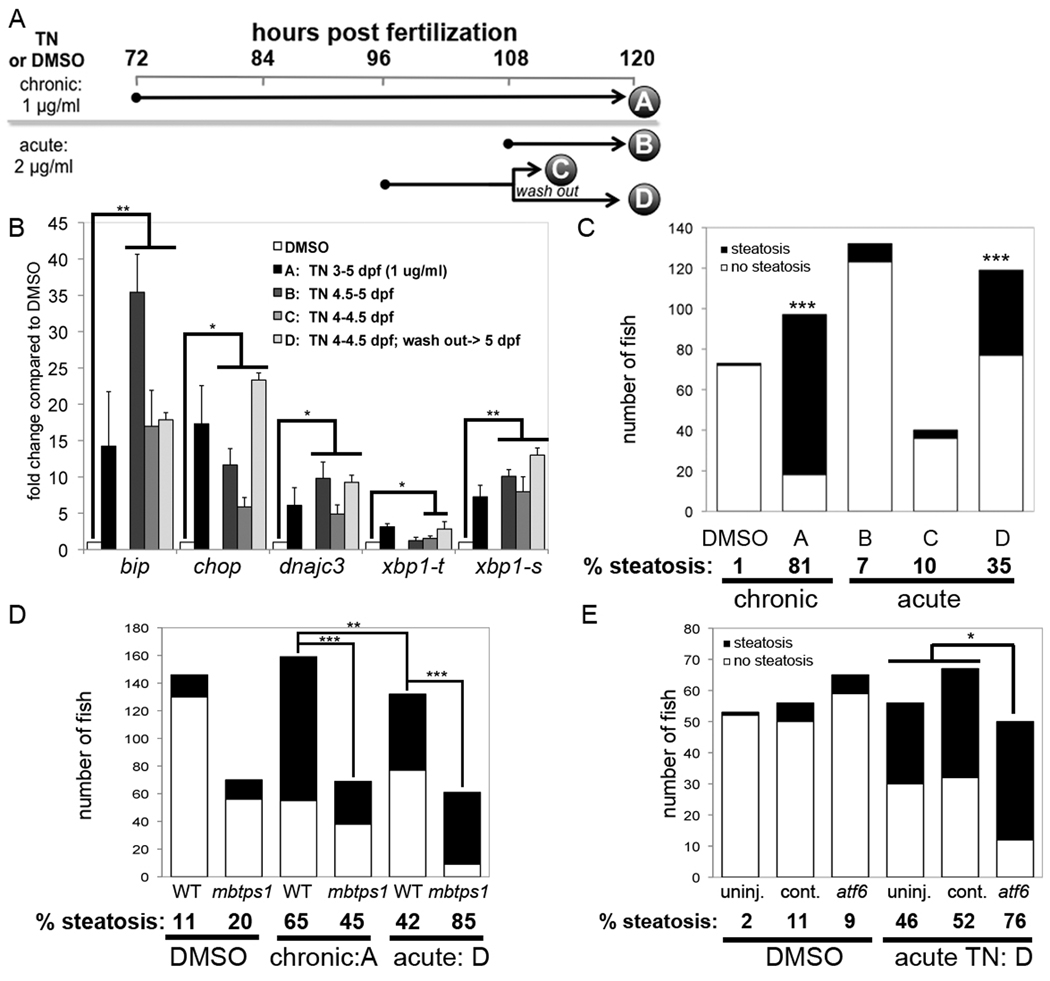
Figure 8. Acute tunicamycin treatment causes UPR activation and steatosis that is augmented by atf6 depletion.
A. Diagram of tunicamycin exposure protocols. Larvae treated with DMSO or tunicamycin for 48 (chronic; 1 µg/ml) or 12 (acute; 2 µg/ml) hours. Samples were collected at the times indicated by each letter for qPCR or oil red O staining. For protocol D, larvae were treated as in C, the tunicamycin was washed out and larvae were incubated for an additional 12 hours. B. UPR target genes were induced by all 4 protocols. The fold change for each gene in was calculated relative to DMSO (set as 1) at least 3 clutches and averaged. Error bars indicate the standard deviation, * indicates p<0.05, ** indicates p<0.005 by a ANOVA. C. Tunicamycin was administered to zebrafish according to the chronic and acute protocols outlined in panel A. The number of fish with steatosis was scored in whole mount oil red O stained larvae. The percent of steatosis in 3–5 clutches in each sample is labeled below each bar. Control fish were treated with DMSO from 3–5 dpf. The difference between tunicamycin treated and DMSO treated fish was significant for protocols A and D; *** indicates p<0.0001 by Fisher’s exact test. D. mbtps1hi1487 mutants are predisposed to steatosis caused by acute tunicamycin exposure. The number of fish with steatosis was counted in 6 clutches of mbtps1hi1487 mutants and their wild-type siblings that were treated with DMSO from 3–5 dpf or with chronic (protocol A) or acute (protocol D) tunicamycin. ** indicates p<0.002 and **** indicates p<0.0001 by Fisher’s exact test. E. atf6 morphants develop more steatosis in response to acute tunicamycin treatment. atf6 morphants, standard control morphants and uninjected embryos were treated with tunicamycin of DMSO according to protocol D. The total number of 5 dpf fish in 3 clutches that were scored for steatosis based on whole mount oil red O staining is plotted. The percent steatosis for each sample is labeled below each bar. * indicates p<0.02 by Fisher’s exact test.

