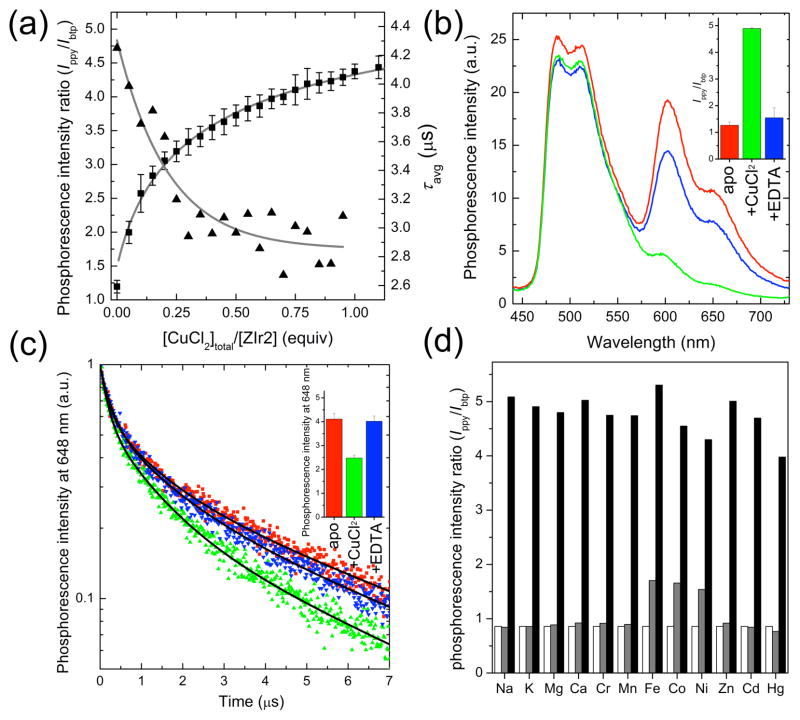
Figure 2.
(a) Phosphorescence titration (squares for phosphorescence intensity ratio (Ippy/Ibtp) and triangles for average phosphorescence lifetime (τavg) of ZIr2 with the addition of CuCl2. See Figures S3 and S5 in Supporting Information for the raw data. (b) Reversible change in phosphorescence spectrum of ZIr2 in response to CuCl2 (red line, Cu(II)-free state; green line, in the presence of CuCl2 (1 equiv); blue line, after subsequent addition of Na2EDTA (100 equiv) to the mixture). The inset depicts the corresponding change in phosphorescence intensity ratio of green (470–570 nm) vs red (580–700 nm) bands. (c) Reversible change in the phosphorescence decay trace of ZIr2 in response to CuCl2 (red symbols, Cu(II)-free state; green symbols, in the presence of CuCl2 (1 equiv); blue symbols, after subsequent addition of Na2EDTA (200 equiv) to the mixture). Black solid lines are fits based on a triple exponential decay model. The inset depicts the corresponding change in the average phosphorescence lifetime. (d) Cu(II) ion selectivity of ZIr2 (white bar, metal-free state; grey bar, in the presence of metal salt (100 equiv for Na+, Mg2+, Ca2+; 10 equiv for Zn2+; 1 equiv for others); black bar, after subsequent addition of CuCl2 (1 equiv)). Conditions: 10 μM ZIr2 for steady-state measurements and 20 μM ZIr2 for time-resolved measurements in pH 7.0 buffer (25 mM PIPES containing <2 vol % of DMSO).

