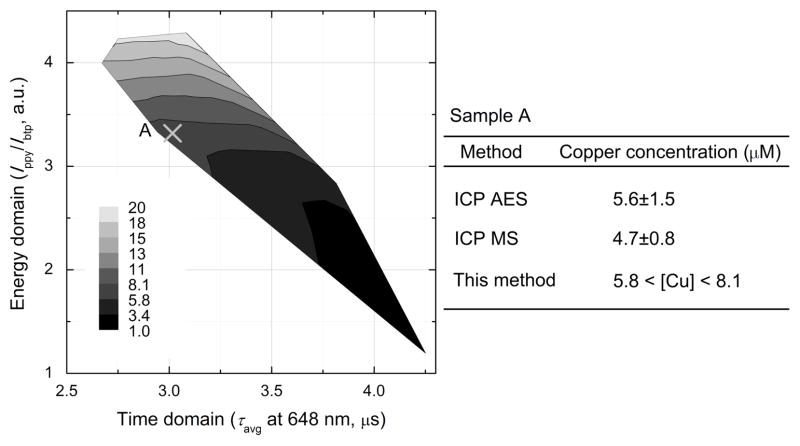
Figure 3.
Contour map showing copper concentration as a function of phosphorescence intensity ratio (Ippy/Ibtp) and average phosphorescence lifetime (τavg) of ZIr2. Also depicted is the quantitation of copper in sample A using the phosphorescence signals. At the right is a comparison of values determined by ICP AES, ICP MS, and the present method.

