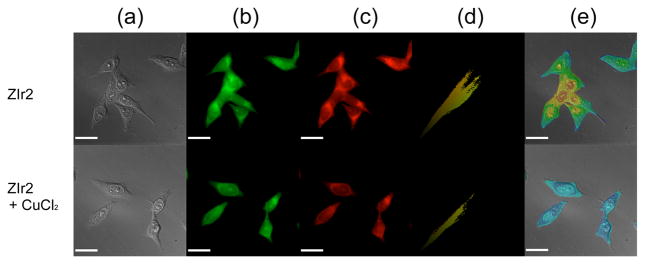
Figure 4.
Intracellular copper imaging of fixed HeLa cells treated with 10 μM ZIr2. Cells in the lower panels were incubated with 500 μM CuCl2 prior to ZIr2 treatment. (a) Differential interference contrast images. (b) Phosphorescence acquired through a green channel (excitation band path = 300–390 nm, emission band path = 510–560 nm). (c) Phosphorescence acquired through a red channel (excitation band path = 400–450 nm, emission cut-on for >600 nm). (d) Colocalization scatter plot of green and red channels. (e) Phosphorescence intensity ratio images of green and red channels. Scale bar corresponds to 25 μm, and an identical scale for color mapping was applied to images (e). See Figure S16 in SI for an enlarged version.

