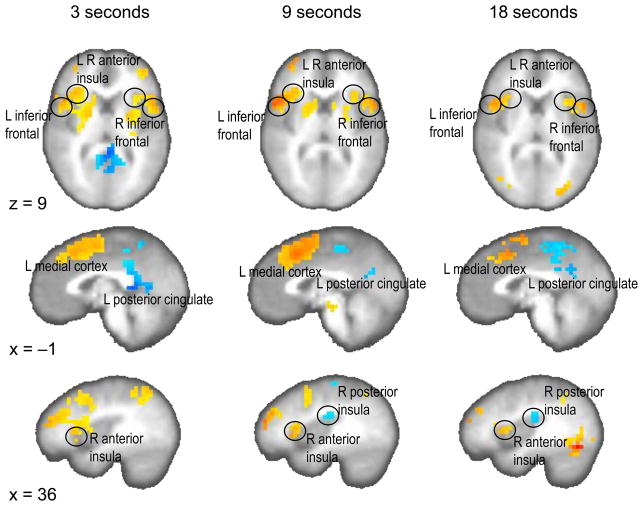
Figure 2.
Significant brain activation for the contrast reproduction phase versus encoding phase (p < 0.01, corrected) on one axial (z = 9) and two sagittal (x = −1, x = 36) planes separately for the three temporal intervals. Stronger activation in the reproduction phase is colored in yellow to red, stronger activation in the encoding phase is coded in blue.

