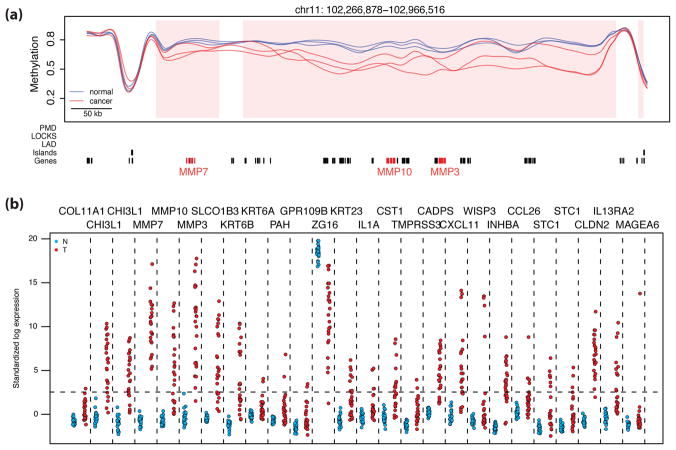
Figure 5. High variability of gene expression associated with blocks.
(a) An example of hypervariably expressed genes contained within a block; note genes MMP7, MMP10, and MMP3 highlighted in red. Methylation values for cancer samples (red) and normal samples (blue) with hypomethylated block locations highlighted (pink shading) are plotted against genomic location. Grey bars are as in Fig. 2. (b) Standardized log expression values for 26 hypervariable genes in cancer located within hypomethylated block regions (normal samples in blue, cancer samples in red). Standardization was performed using the gene expression barcode. Genes with standardized expression values below 2.54, or the 99.5th percentile of a normal distribution (horizontal dashed line) are determined to be silenced by the barcode method26. Vertical dashed lines separate the values for the different genes. Note there is consistent expression silencing in normal samples compared to hypervariable expression in cancer samples. A similar plot drawn from an alternative GEO dataset is shown in Supplementary Figure 18.

