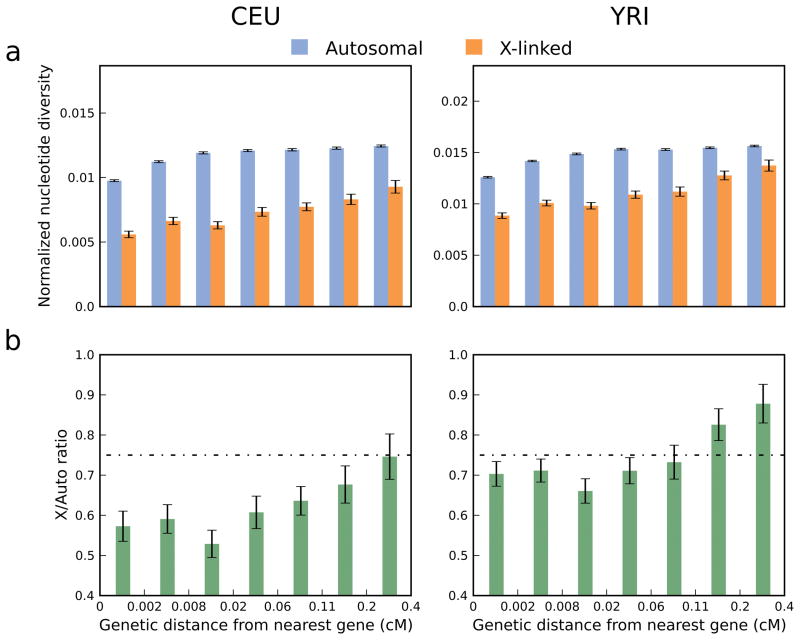
Figure 1. Autosomal, X-linked, and absolute X/A diversity increase with genetic distance from the nearest gene.
(a) Nucleotide diversity normalized by genetic divergence from rhesus macaque for a partition of the genome by distance from the nearest gene (Supplementary Methods). Note the different scale of the y-axis for the two populations (CEU and YRI), which is proportional to autosomal normalized diversity. (b) X/A ratios corresponding to the estimates from panel a (horizontal line represents the expectation of ¾). In all panels, x-axis labels represent the boundaries between partitions, which were selected such that each partition encompasses an equal fraction of chromosome X (Supplementary Figure 2). Error bars denote ± one standard error estimated by a block bootstrap approach (Supplementary Methods). Similar results were obtained when divergence from orangutan was used for normalization (Supplementary Figure 3) and similar trends were also observed when considering only levels of human nucleotide diversity, without any normalization by divergence (Supplementary Figure 4).

