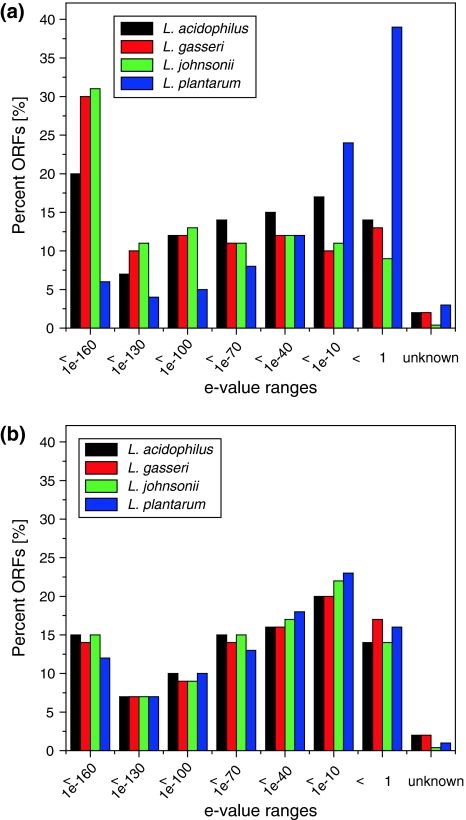
Fig. 6.
Differences in e-value distribution between the four lactobacilli of human origin when compared to the two custom databases dbLB and dbLAB. Based on the best BlastP hit, similarities were grouped within the assigned e-value ranges. Solid bars represent results for the custom Lactobacillus database dbLB (a) and the custom LAB database dbLAB (b). E-value ranges correspond to trust level intervals described in Table 2 (color figure online)

