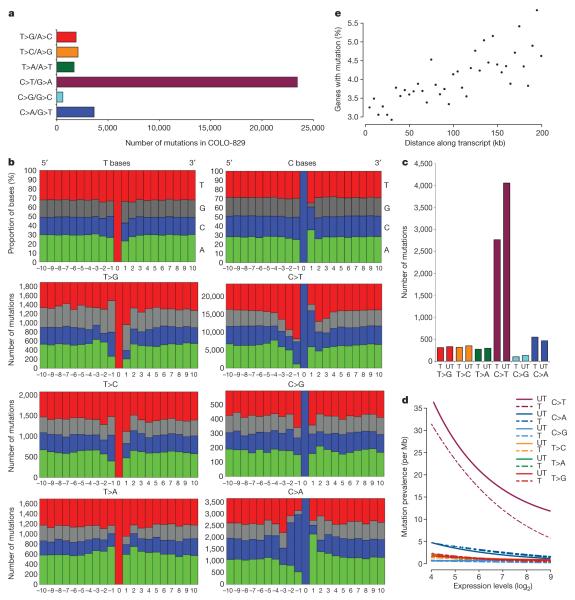
Figure 2. Patterns of somatic substitution.
a, Mutation spectrum. b, Mutation sequence context compared to random T bases and C bases (top two panels). c, Mutation counts by transcribed (T) and untranscribed (UT) strands. d, Effect of gene expression on mutation prevalence. Lines are parametrically fitted curves to the data. Mutation prevalence is expressed as the number of mutations per Mb of each class. T, transcribed strands; UT, untranscribed strands. e, Effect of distance along the transcript on mutation prevalence. Each dot represents a 5-kb bin along gene footprints, from transcription start sites to 200 kb. The y axis shows the fraction of genes in each bin carrying a somatic mutation.

