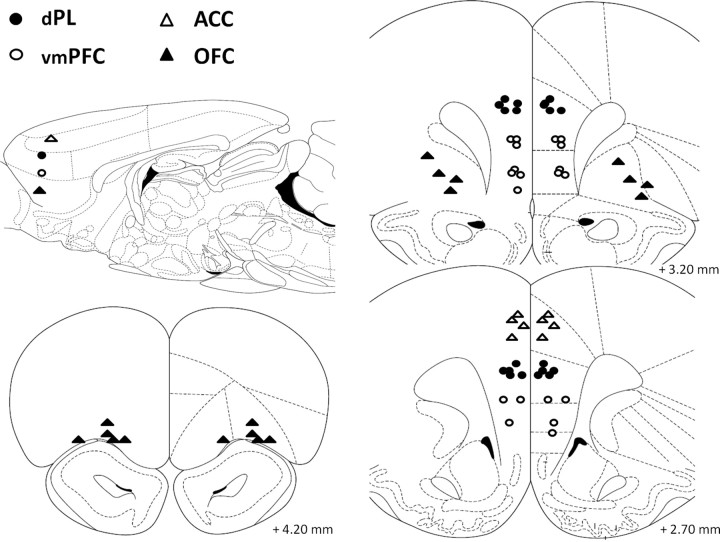
Figure 2.
Schematic representation of the position of the injector tips in experiment 1 (muscimol microinfusions; 0.5 μg/0.5 μl per side) as revealed by histological analysis. The sagittal view approximately shows the areas targeted by injectors on the sagittal plane. Open triangles, ACC (n = 4); filled circles, dPL (n = 12); open circles, vmPFC(n = 10); filled triangles, OFC (n = 9). Drawings adapted from Paxinos and Watson (1998).

