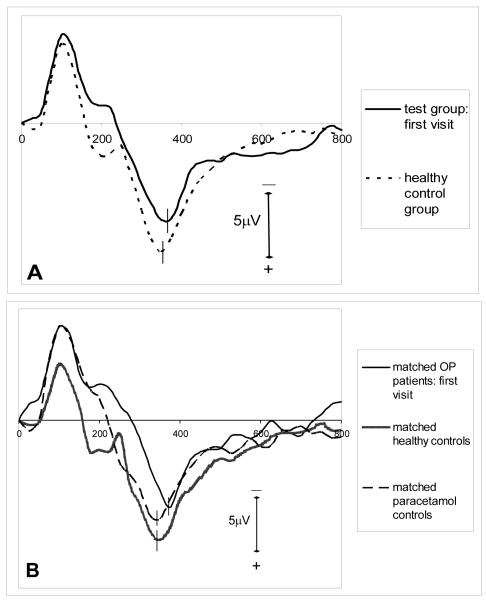
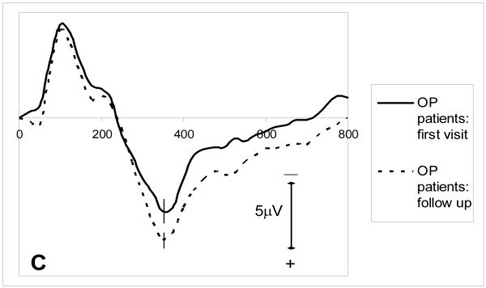
Figure 2.
grand average ERP waveforms for target tones: (A) test group (first visit) (n=32) and healthy control group (n=32) (B) subgroup of OP poisoned patients (first visit) (n=9), matched healthy controls (n=9) and matched paracetamol controls (n=9) (C) first visit and the follow up recordings of the OP poisoned patients who were followed up (n=21).


