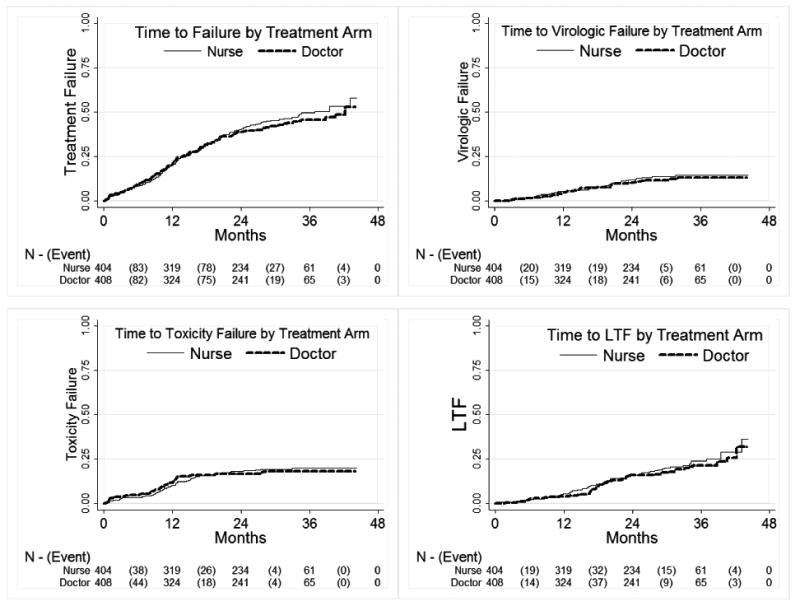
Figure 2.

Figure 2a: Kaplan-Meier curves of time to cumulative treatment failure by study arm among 812 subjects randomised to doctor or nurse monitored antiretroviral therapy in the CIPRA-SA trial in South Africa; Figure 2b-d: Kaplan-Meier curves of time to specific reasons for treatment failure by study arm among 812 subjects randomised to doctor or nurse monitored antiretroviral therapy in the CIPRA-SA trial in South Africa*
* a) a Kaplan-Meier curve demonstrating the composite end-point of cumulative treatment failure. The primary health care nurse arm of the study is non-inferior to the doctor arm (log-rank p-value 0.4238). b) shows time to virologic failure stratified by treatment ARM (log-rank p-value = 0.5340); c) shows time to toxicity failure stratified by treatment ARM (log-rank p-value = 0.4678); d) shows time to loss to follow-up stratified by treatment ARM (log-rank p-value = 0.8358);
