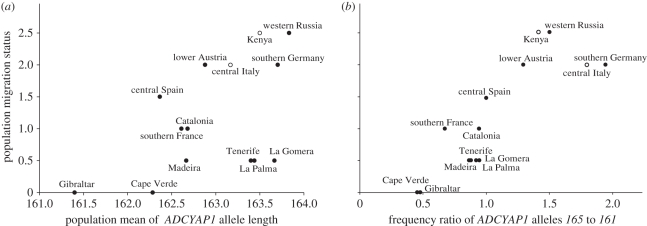
Figure 4.
The association between population migration status and (a) population mean of ADCYAP1 allele length (Spearman rank correlation: ρ = 0.57, p = 0.034) or (b) the frequency ratio between ADCYAP1 alleles 165 and 161 (Spearman rank correlation: ρ = 0.87, p = 0.000054). Here, the winter samples of Kenya and central Italy are included in the analyses.

