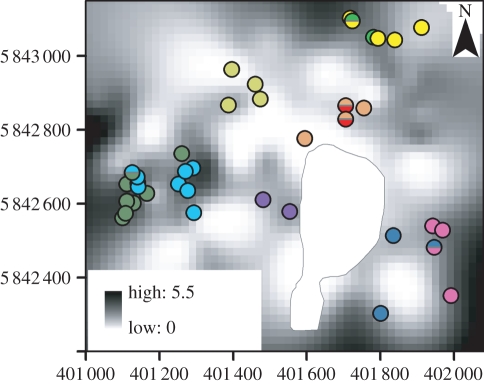
Figure 1.
Map showing spatial variation in the density of hollow-bearing trees across the Cambarville study site. Local density of hollow-bearing trees in this map was interpolated in Anusplin v. 4.37 [32] from 115 regularly spaced survey points as a function of geographical coordinates and forest age (reflecting past fire history). Coloured circles represent the den trees used by a subset of 10 of the 20 individual mountain brushtail possums studied. Each individual is represented by a different coloured circle. Den trees used by more than one individual are represented by circles with more than one colour. The grey polygon in the centre of the map represents a clearing in the study area. The x- and y-axes show eastings and northings coordinates according to the Geodetic Datum of Australia Zone 55S.

