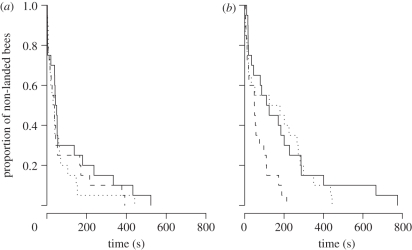
Figure 2.
Kaplan–Meier survival curves of the time to first landing for the (a) simple and (b) complex floral communities, depending on the density of demonstrators: ‘none’, ‘low’ and ‘high’. These discrete, stepped survivorship curves represent the cumulative proportion of flying bees before the first landing (‘non-landed bees’) over time. Solid lines indicate the distributions of bumble-bees foraging at none, dashed lines at low and dotted lines at high density of demonstrators. The two successive sequences were not individually represented (n = 10 individuals per experimental treatment).

