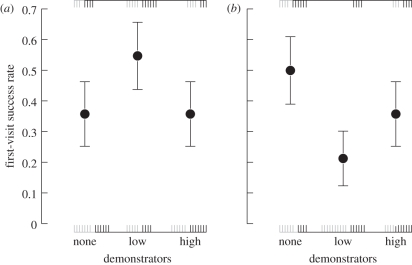
Figure 3.
First-visit success rate of focal bumble-bees for the (a) simple and (b) complex floral communities, depending on the density of demonstrators: none, low and high. Values are the estimated mean ± s.e. predicted by the selected statistical model (generalized linear mixed effects model with repeated measures, lmer function, link = logit). The statistical model fitted empirical binary data corresponding to the vertical dashed lines: first visit to a high-quality flower at the top and first visit to a low-quality flower at the bottom of the plot. Grey vertical dashed lines represent the numbers of individual first visits for the first sequence and black ones for the second sequence (n = 10 individuals per experimental treatment).

