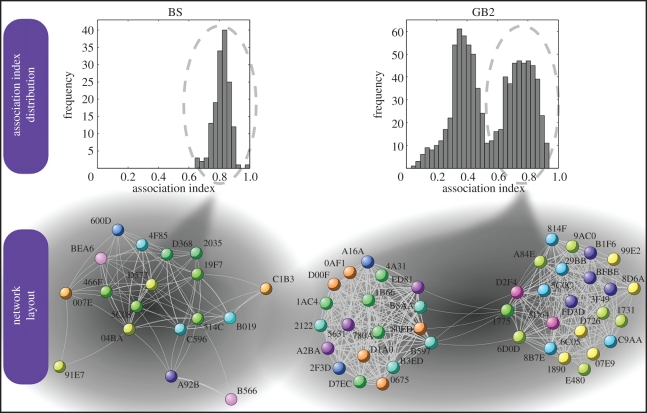
Figure 2.
From pairwise association to social networks in two Bechstein's bat colonies. The upper graphs show the frequency distribution of the strength of associations (Iij) in the colonies BS (left) and GB2 (right), in the year 2007. The lower graphs show the corresponding social networks in each colony. The social network is fully connected as all pairs of bats roosted together at least once. For clarity purposes, however, only links belonging to the upper mode of the distribution are included in the visualization (strong links), even though all (weak and strong) links are used for the calculations. Networks layouts were produced with Cuttlefish (http://cuttlefish.sourceforge.net). GB2 forms two distinct communities whereas no modular structure is visible in BS. The bats (nodes of the network) are identified by their printed PIT-tag numbers. Different colours of the nodes depict different matrilines within each colony. Members of a given matriline always belong to the same community in GB2.

