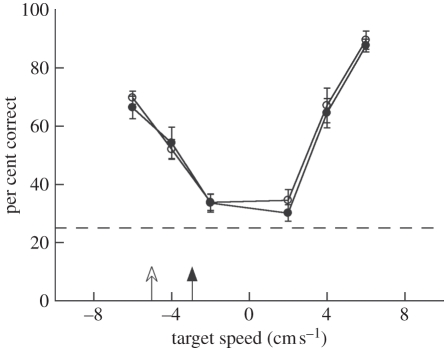
Figure 3.
Performance accuracy on the visual-only condition for observer speeds of 3 cm s−1 (black circles) and 5 cm s−1 (white circles). Data from the 10 subjects who participated in both conditions are shown. Arrows indicate the speeds at which an object would appear stationary on the screen (observer velocity equal to target object velocity). Error bars are s.e.m. across subjects.

