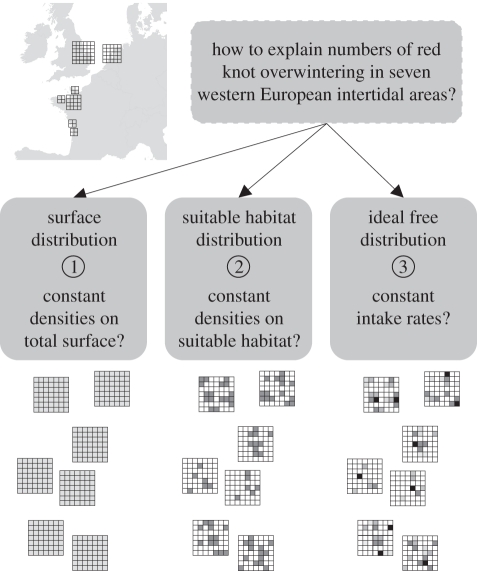
Figure 1.
Basic overview of the three approaches used for explaining the distribution of knots overwintering in seven study sites across western Europe. (1) A null model, the ‘surface model’, which assumes a constant density across the total intertidal surface; (2) a suitable habitat model that assumes a constant density across the suitable surface; (3) an IFD model that assumes a constant density-dependent intake rate throughout suitable habitats. In all three models, the grey shading indicates the relative density of foragers (the highest densities at the darkest stations) across different sites that vary in food abundance.

