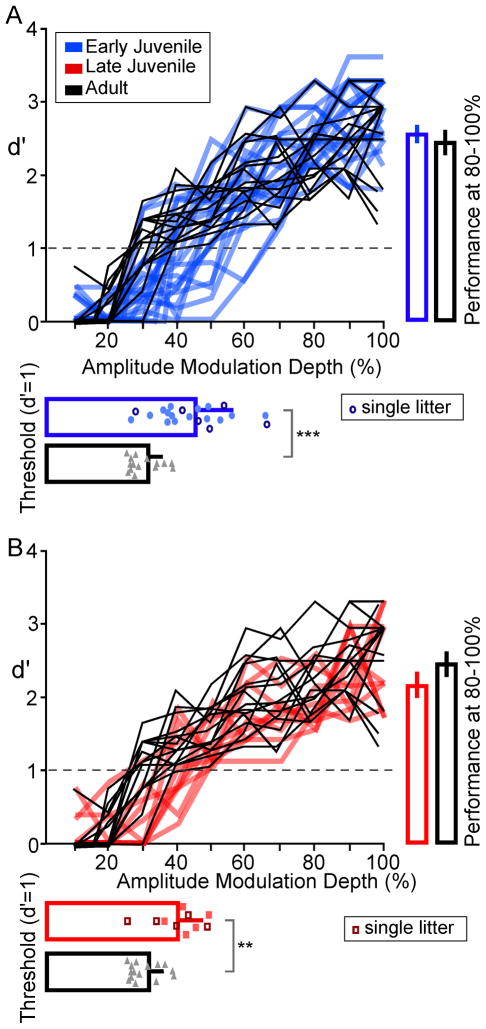
Figure 2.
Developmental emergence of naïve AM detection thresholds. A, B. Individual psychometric functions are shown for the naïve AM detection thresholds, as determined with random stimulus presentation (see Methods). In panel A, Early Juveniles (thick, blue lines) are compared with naïve Adults (thin, black lines). In panel B, Late Juveniles (thick, red lines) are compared with naïve Adults (thin, black lines). All animal groups display a similar ability to perform the task at large AM depths (80–100%), as shown by bars on right of both graphs. However, detection thresholds at d′=1 were significantly higher and more variable for Early Juveniles and Late Juveniles, compared with Adults, as shown by data points below the curves. The bars placed over these data points represent the mean and SEM of AM detection (Early Juveniles, blue circles; Late Juveniles, red squares; Adults, gray triangles; ***, p<0.001; **, p<0.002). For both Early and Late Juveniles, data points with a dark outline represent data from animals within a single litter. This illustrates that one litter did not bias the group mean.

