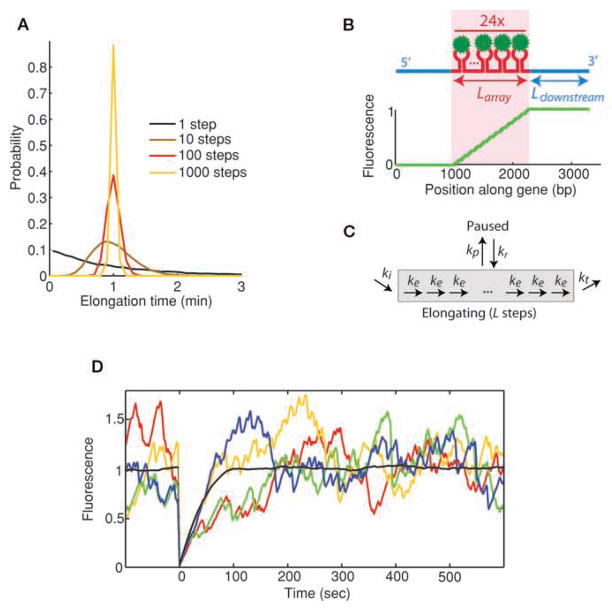
Figure 1.
(A) Distribution of elongation times depending on number of substeps involved. All models have the same average elongation time, but distributions narrow around the mean as the number of steps increases. Elongation of a kilobase-long gene involves at least 1000 steps. (B) MS2 system used in the simulations. Fluorescent proteins (green) bind to an array of hairpin loops (red) encoded within a specific mRNA (blue). (Bottom) Fluorescence of a nascent chain as a function of its position along the gene is plotted. (C) Schematic representation of kinetic model used in the simulations. Pausing and termination steps are separately added to the elongation pathway. (D) Individual Monte Carlo simulations (colors) are shown superimposed with the average of 300 photobleaching cycles (black). Because the number of polymerases present on the gene at a given time is low (~20), relative fluctuations observed in individual recovery curves become important. Initiation rate ki = 0.2 s−1, elongation rate ke = 15 bp/s−1, termination rate kt = 15 s−1, no pausing.

