
Figure 4.
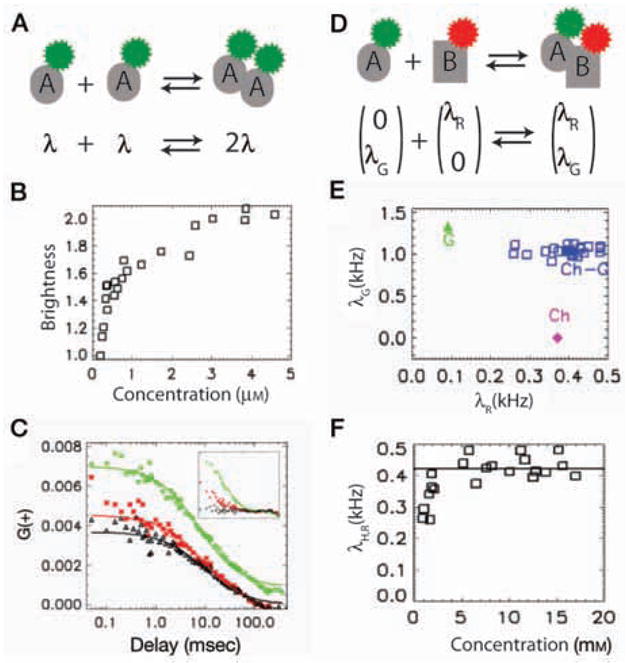
Application of FFS to study molecular interactions. (A) Monomer A carries a single fluorophore (brightness λ). Dimer A2 is twice as bright (2λ). (B) Brightness analysis of homodimerization of RXR in CV-1 cells. Brightness of EGFP–RXRLBD is measured in the nucleus after adding the ligand 9-cis retinoic acid and is plotted as a function of concentration. For convenience, brightness is normalized to monomer EGFP brightness. (C) Application of FCCS to study interactions between EGFP–RXRLBD and mCherry–RARLBD. CV-1 cells are cotransfected with EGFP–RXRLBD and mCherry–RARLBD. Autocorrelation functions of the green (green diamonds) and red (red stars) channel are plotted along with the cross-correlation function (black triangles). Cross-correlation amplitude is comparable to that of the red channel correlation amplitude, indicating a strong interaction. (Inset) Correlation functions of a mixture of EGFP and mCherry in a CV-1 cell. Cross-correlation amplitude is close to zero because there is no interaction between EGFP and mCherry. (D) In a two-color experiment, brightness is represented as a two-dimensional vector: Green molecule A (0, λG) and red molecule B (λR, 0) form a complex with the resulting brightness (λR, λG). We can deduce oligomeric state of a species by comparing its brightness with that of corresponding monomers. (E) Application of HSP to study interaction displayed in D. Brightness data points of the heterospecies (blue squares) are clustered around the brightness expected for 1:1 EGFP:mCherry stoichiometry. (F) Averaged red channel brightness of heterospecies, which directly measures the fraction of EGFP–RXRLBD that binds mCherry–RARLBD, is plotted as a function of concentration of mCherry–RARLBD.