
Figure 5.
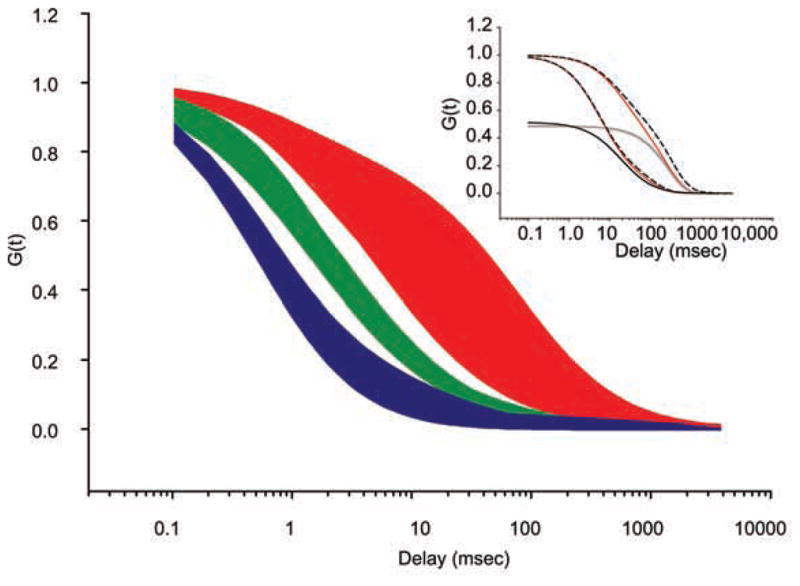
Compiled nuclear FCS data from previous studies. Reported fit parameters are used to calculate FCS curves by assuming standardized focal volume dimensions (wxy = 0.250 μm, wz = 0.650 μm). (Blue) Diffusion of noninteracting monomers (typically EGFP), (green) multimers, and (red) DNA-binding factors. (Inset) Theoretical fits to the data from the main panel. Boundaries of the red area are fit with a reaction-dominant approximation (Eq. 4, red solid lines) and compared to the full-theoretical solution with no approximation for the same parameters (black dashed lines). Individual components of the reaction-dominant approximation are shown separately: diffusion (black solid line) and reaction (gray solid line).