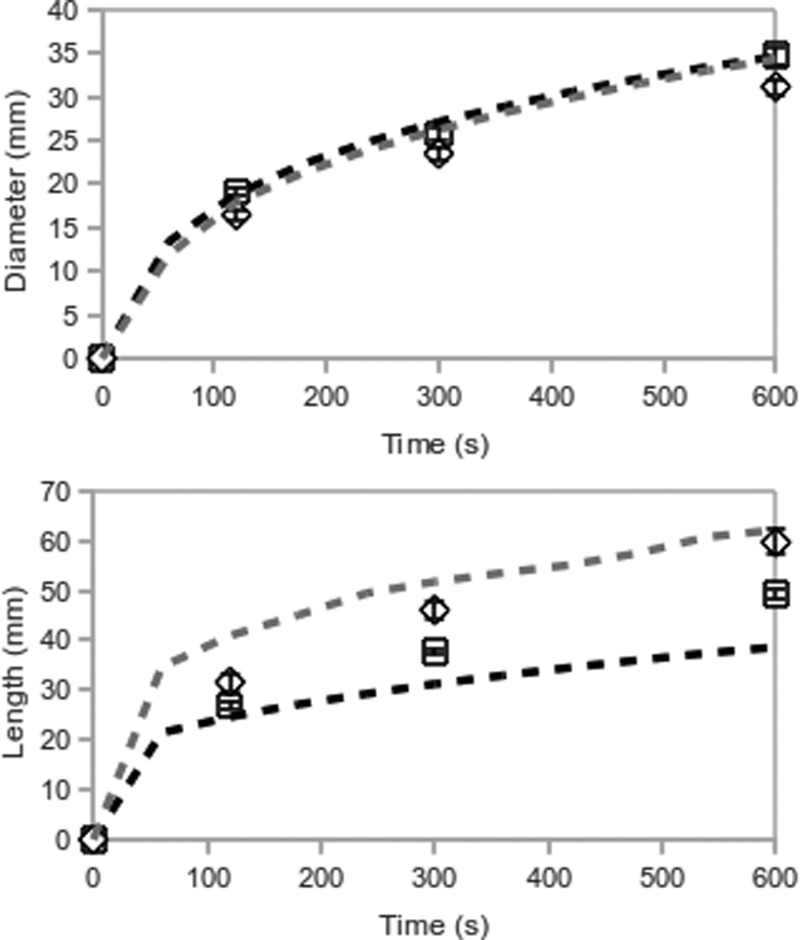
Figure 10.
Mean diameters and lengths of ablations created by the optimal dual-slot (black∕square) and monopole (gray∕diamond) antennas. Simulations are represented by dashed lines, experiments by symbols. The 50 °C isotherm defined the ablation boundary in simulations. Bars represent the standard error of the mean in experimental data.

