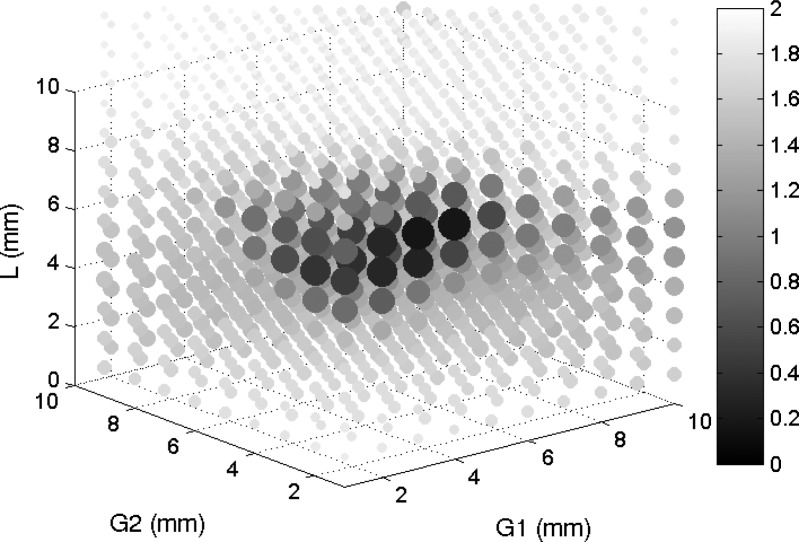
Figure 3.
Three-dimensional scatterplot of objective function values for all input permutations. More desirable (lower) values are noted by large dark dots. This plot allows visualization of the influence of each geometric parameter, with the best objective values clustered around the G1 = 1 mm, L = 8 mm, G2 = 4 mm region.

