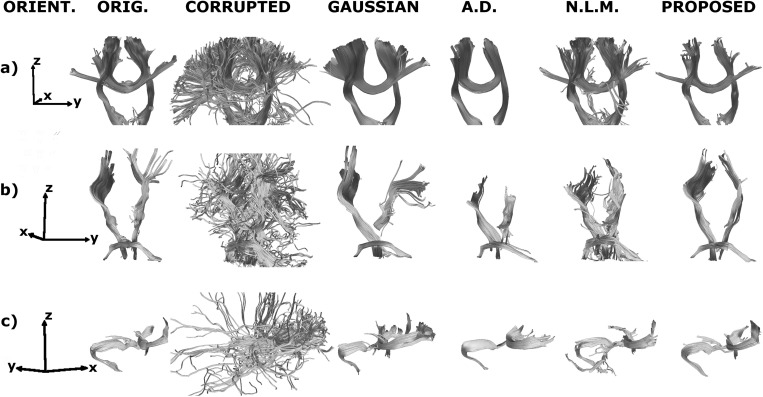
Figure 9.
3D reconstruction of the fiber tracking output for the uncorrupted, corrupted (SNR = 10 dB) and denoised volumes of a sample test brain. The relative orientation of the reconstruction is displayed in the leftmost column: x represents posterior to anterior, y is right to left, and z is inferior to superior. The yellow spheres mark the seed regions. a) Corticospinal tract and corpus callosum b) Corticospinal tract and middle cerebellar peduncle. c) Corpus callosum, capsule fibers, and superior frontal gyrus fibers.

