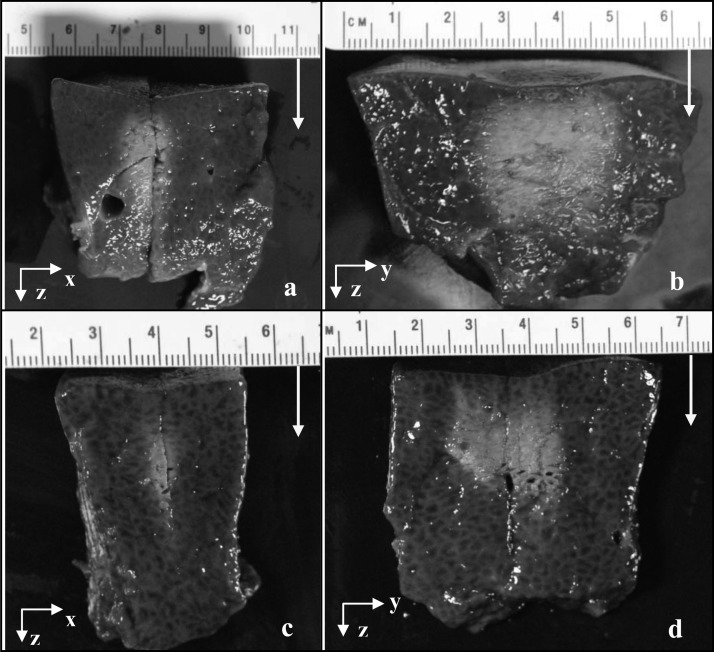
Figure 11.
Photographs of thermal ablation lesions created by the static SonoKnife prototype in porcine liver ex vivo. Two different lesions are shown, one in (a) and (b), and the other in (c) and (d). The acoustic frequency was 3.5 MHz. The sonications used an acoustic power of 108 W for 30 s aimed at 1.5 cm deep and for 20 s aimed at 2 cm deep for the first and second samples, respectively. In (a) and (c) it can be seen the samples were cut to reveal the lesions in the y–z planes shown in (b) and (d). The yellow arrows denote the direction of acoustic propagation.

