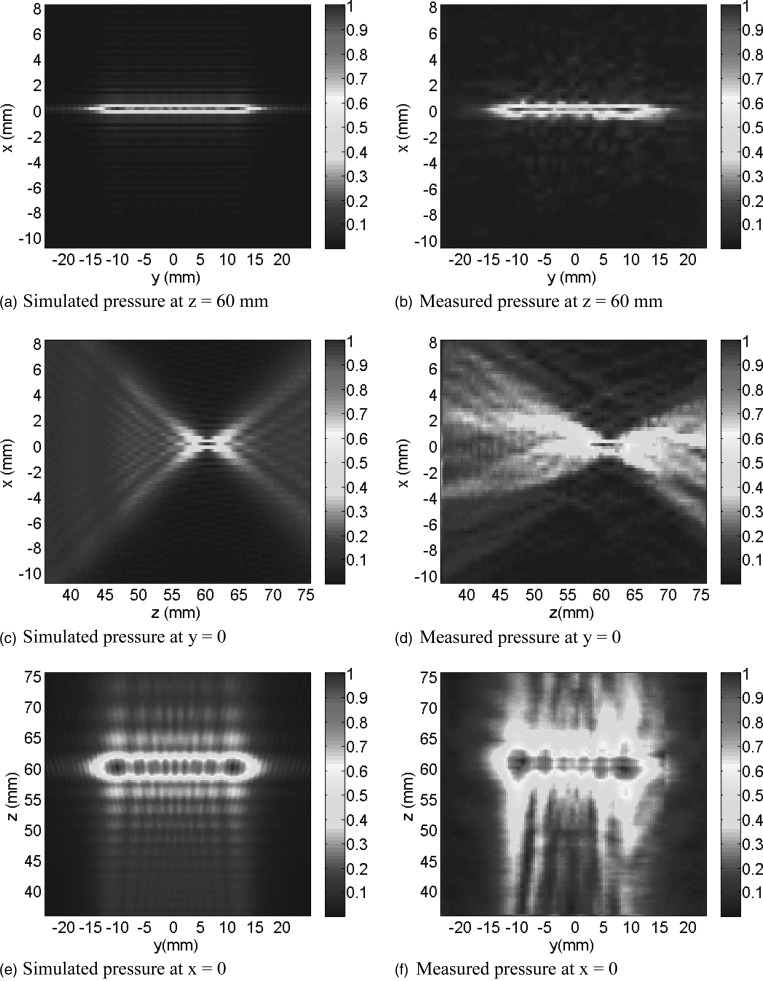
Figure 3.
Simulated (a, c, and e) and measured (b, d, and f) pressure distributions on the central y–z plane (x = 0), central z–x plane (y = 0) and central y–x plane (z = 60 mm). The frequency was that of the SonoKnife prototype, 3.5 MHz. All other parameters had nominal values (Table Table I.). Both the simulated and measured pressure distributions were self-normalized. See Fig. 1 for the reference frame.

