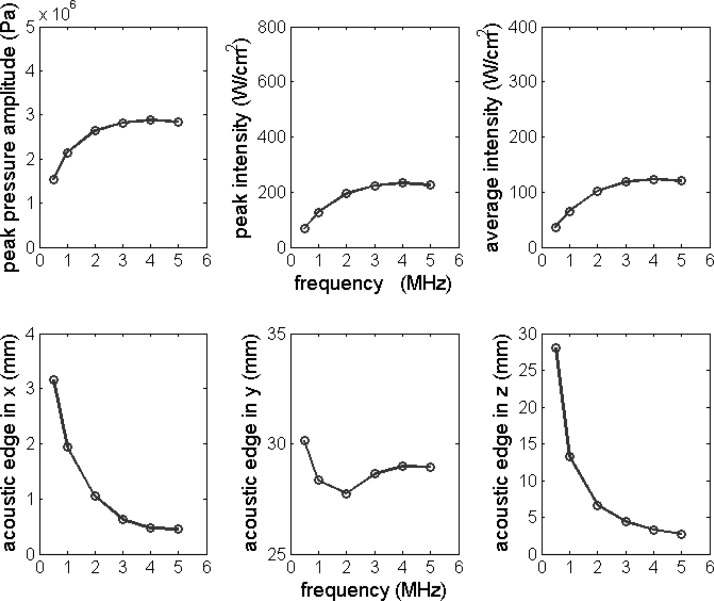
Figure 4.
Peak pressure amplitude, peak intensity, average intensity, and acoustic edge dimensions in the x, y, and z directions plotted as a function of excitation frequency f. Nominal parameter values in Table Table I. were used except for the excitation frequency, which was varied from 0.5 to 5.0 MHz.

