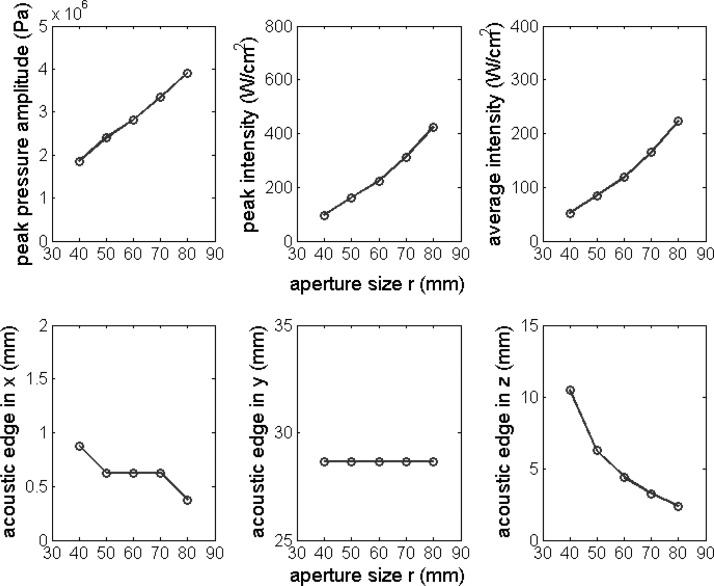
Figure 6.
Peak pressure amplitude, peak intensity, average intensity, and the acoustic edge in the x, y, and z directions plotted as a function of aperture size r. Nominal parameter values in Table Table I. were used except for the aperture size r, which was varied from 40 to 80 mm with an interval 10 mm.

