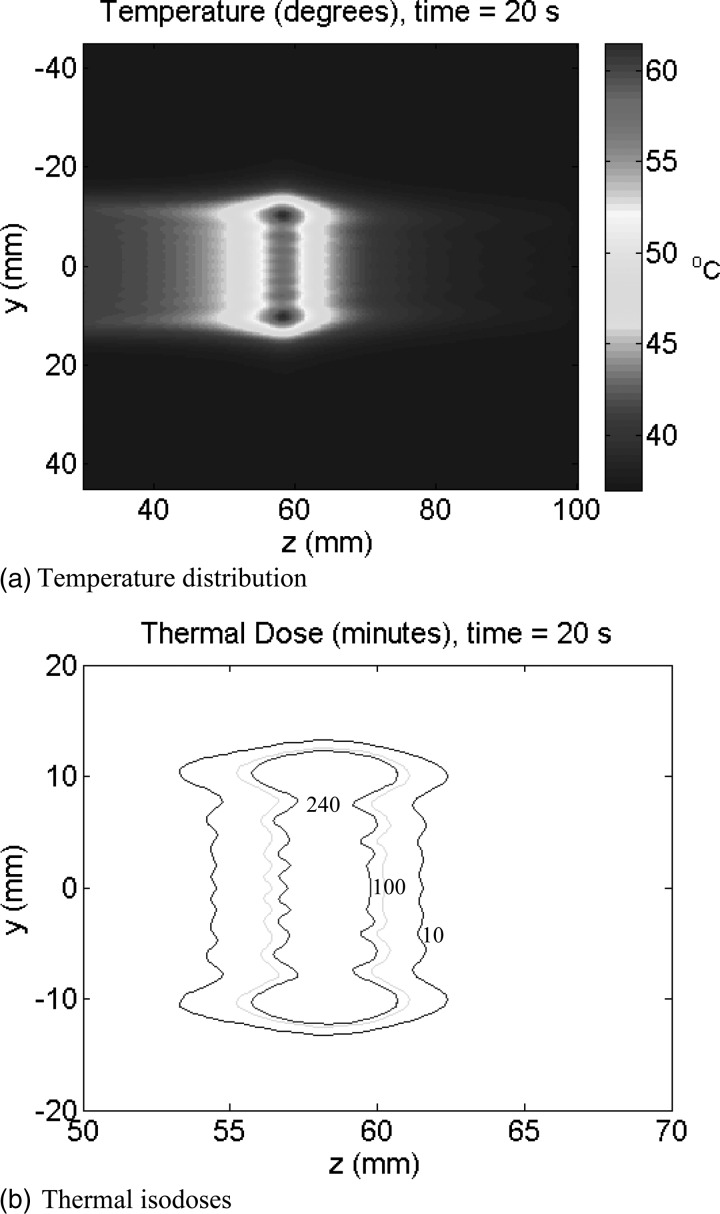
Figure 8.
Focal plane temperature and thermal dose distributions on the central y–z plane (x = 0) after 20 s of static sonication. Nominal parameter values were used. Note that in 9(b) the scales were changed to zoom in into the ablation zone. The three iso-contours in 9(b) are the 10 (outer), 100 and 240 (inner) EM43.

