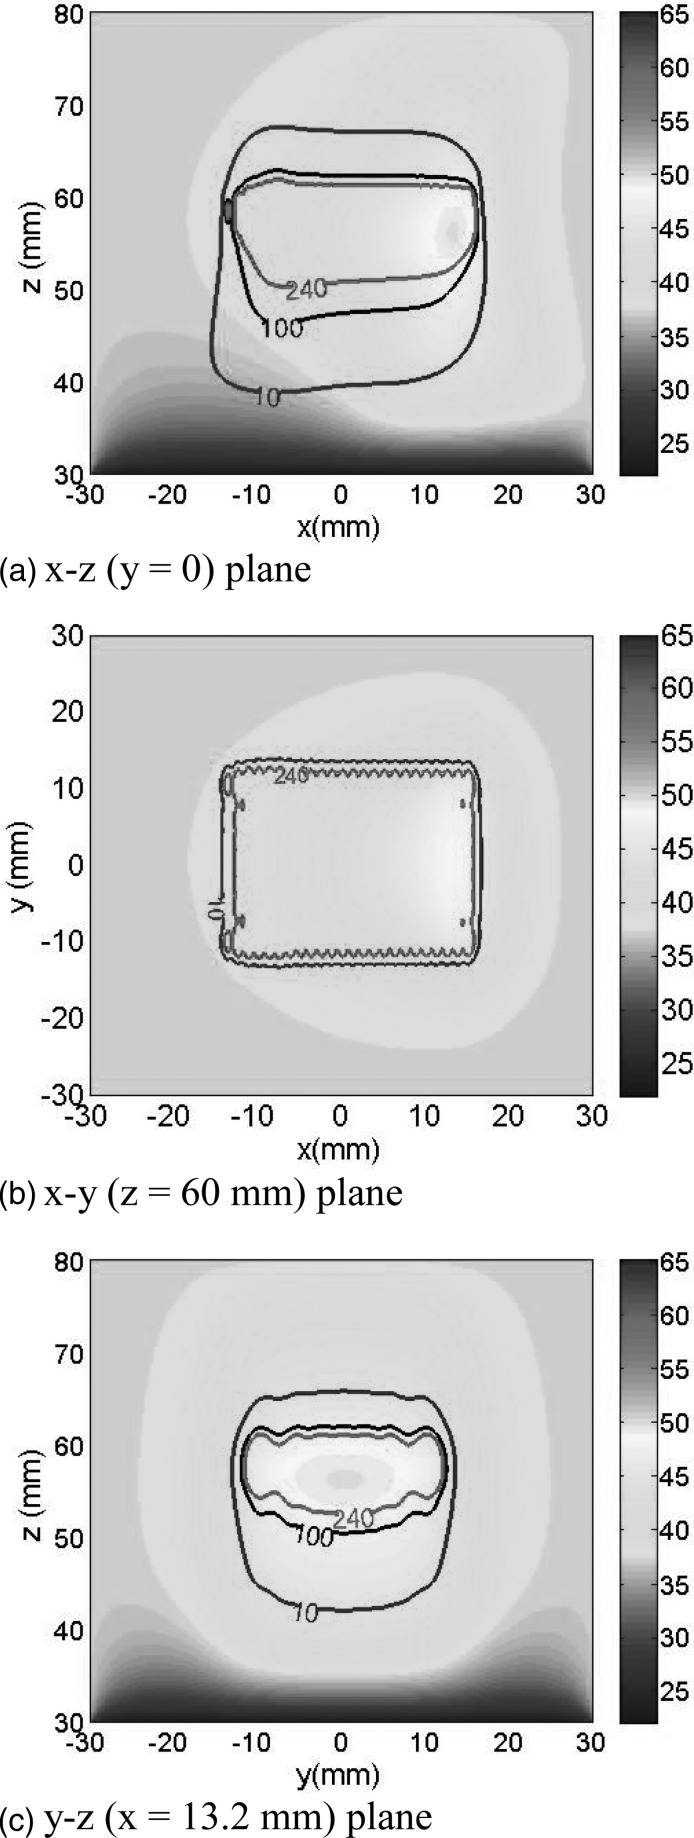
Figure 9.
Temperature and thermal dose distributions on (a) the central z–x plane (y = 0), (b) a y–x plane (z = 60 mm), and (c) a y–z plane (x = 13.2 mm) after step-scanning the acoustic edge in the x direction from −15 to 15 mm. The scanning step was 1.25 mm for a total of 24 steps. For scanning steps 1–3, 4–6, and 7–24, the power-on times were 5.8, 5.0, and 4.15 s/step, respectively. The power-off time in-between sonications was 30 s; consequently, the time to complete the entire scan was 797 s. Nominal parameter values were used except for: the emittance was equal to 6 W/cm3, Wb was set to zero at points that reached 240 EM43, and the skin temperature was held at 22 °C to simulate forced cooling. The contours shown represent the cumulative 10 (blue), 100 (black), and 240 (red) EM43 thermal isodoses after the scan was completed. In (b) only two isodose contours are plotted for clarity.

