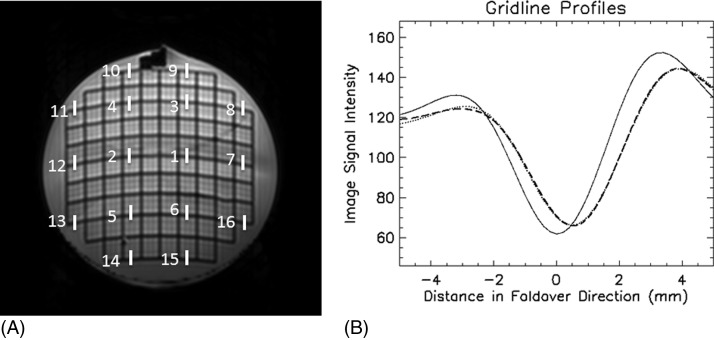
Figure 3.
Evaluation of distortion by diffusion-encoding gradient at 3 T. (A) The segments indicate the locations where the gridline profile was compared between the B0 and average of high-b-value images. (B) The grid profile for a segment in (A). The solid line was the gridline profile on b = 0 image, the dashed line was the profile of the averaged high-b images, and dotted line was fit by Eq. (1). The intensity of the high-b-value profile was multiplied by 7.5.

