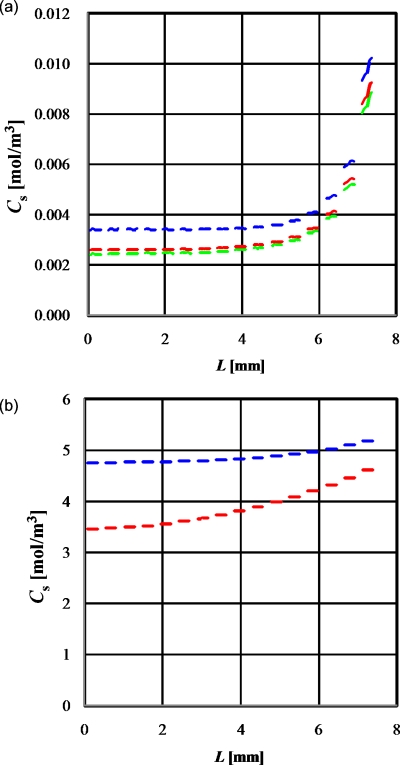
Figure 3.
Concentration profiles at the surface of the cell layers aligned at 45° in the microwells as per the static culture model shown in Fig. 1. (a) Oxygen concentration at 1900/4, 1900/2, and 1900 s for blue, red, and green lines, respectively. (b) Glucose concentration at 4040 s and 10×4040 s for blue and red line, respectively.

