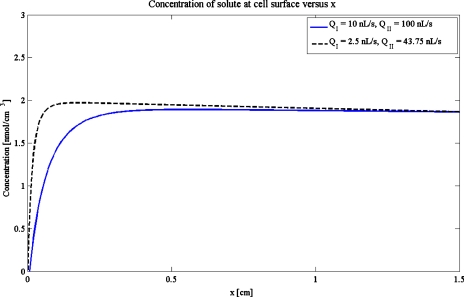
Figure 7.
Reduction of the depletion zone in the bilayer construct. The solid blue curve is the concentration profile in the bilayer construct if QI=10 nL∕s and QII=100 nL∕s. The depletion zone, which extends approximately 0.25 cm, may be reduced in extent if we choose QI=2.5 nL∕s and QII=43.75 nL∕s (dashed black curve). The subsequent reduction is by a factor of about 4. Other parameters are those for Case 2.

