
Fig. (1).
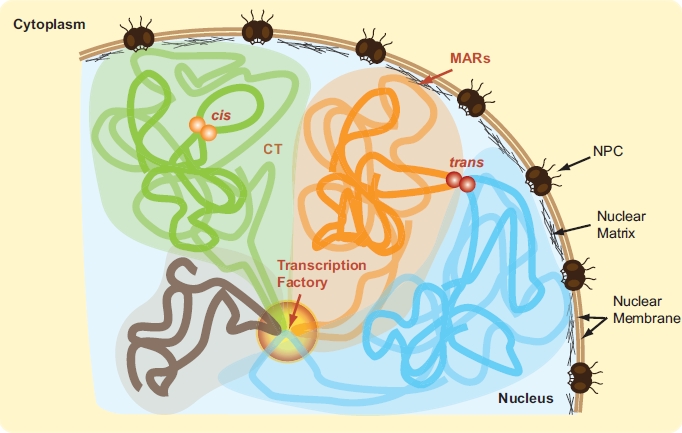
In vivo genome organization. Individual chromosomes are illustrated by thick green, orange, blue and grey strokes. Respective chromosome territories (CT) are highlighted in corresponding colors. Chromatin interactions within (cis) and between (trans) chromosomes are represented by orange and red spheres. Transcription factory is shown as a graded circle. MARs: matrix attachment regions. NPC: nuclear pore complex. (For interpretation of the references to color in this figure legend, the reader is referred to the web version of this paper).