
Figure 3.
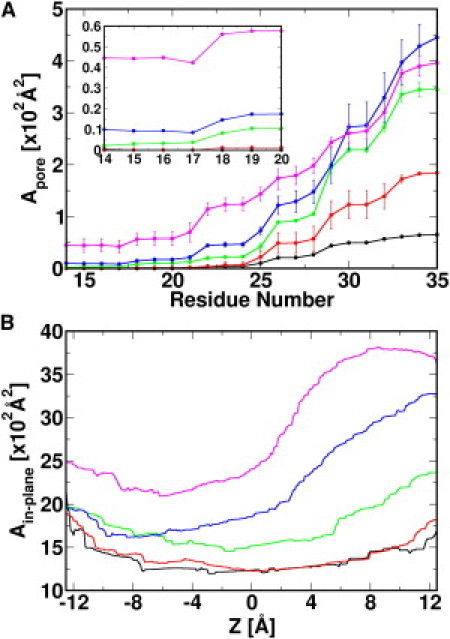
(A) Solvent accessible area profile along TM1 residues. The inset shows Apore near the constriction zone. The SDs are calculated from 5-ns sequential trajectory pieces in the last 30-ns simulation. (B) Ain-plane profile along the Z axis. Area profiles are plotted for the x-ray structure (black), δτ1 (red), δτ10 (green), δτ20 (blue), and δτ30 (magenta).