
Figure 5.
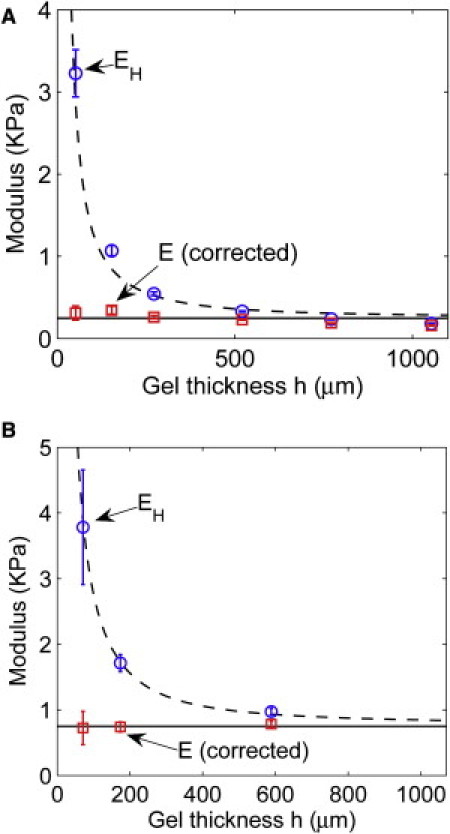
Correcting the finite thickness effect in microsphere indentation experiments. The circles are the EH value calculated using Hertz theory and the measured δ. The squares are the corrected modulus E calculated using Eq. 6 and the measured δ. Error bars represent the SD from six measurements. The solid lines indicate the average values of the corrected modulus: (A) 249 Pa and (B) 750 Pa. The dashed lines are guidelines for data points from Hertz theory. The solid level lines indicate that the gel modulus is independent of the gel thickness.