
Figure 4.
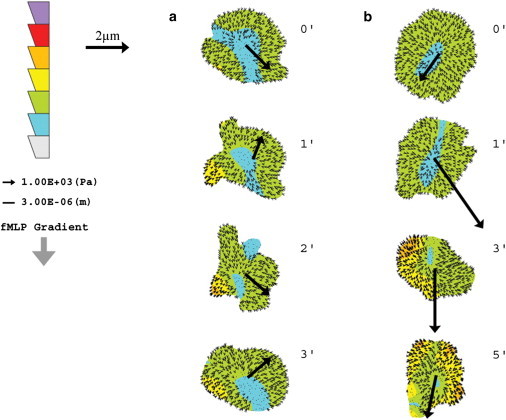
Spatial and temporal distribution of neutrophil traction stresses on a soft hydrogel in response to varying fMLP gradients. (a and b) Neutrophil traction stress maps on soft hydrogels (2 kPa) in response to a uniform solution of fMLP (Δc/Δx = 0, CM = 10 nM) (a) and a steep gradient of fMLP (Δc/Δx = 10 nM/10 μm, CM = 100 nM) (b). The cell diameter of a neutrophil was assumed to be ∼10 μm. Traction stress maps were collected at 1- or 2-min intervals as indicated. Large arrows drawn from the center of each cell indicate the direction of motility in the next time frame, and the length of the arrow corresponds to the magnitude of displacement. The direction of increasing fMLP concentration within the gradient in b is indicated by the downward arrow at the left. The color scale bar at the left indicates the magnitude of traction stress, with the highest magnitude of stress at the top. Smaller arrows within each cell show the direction and magnitude of force vectors.