
Figure 5.
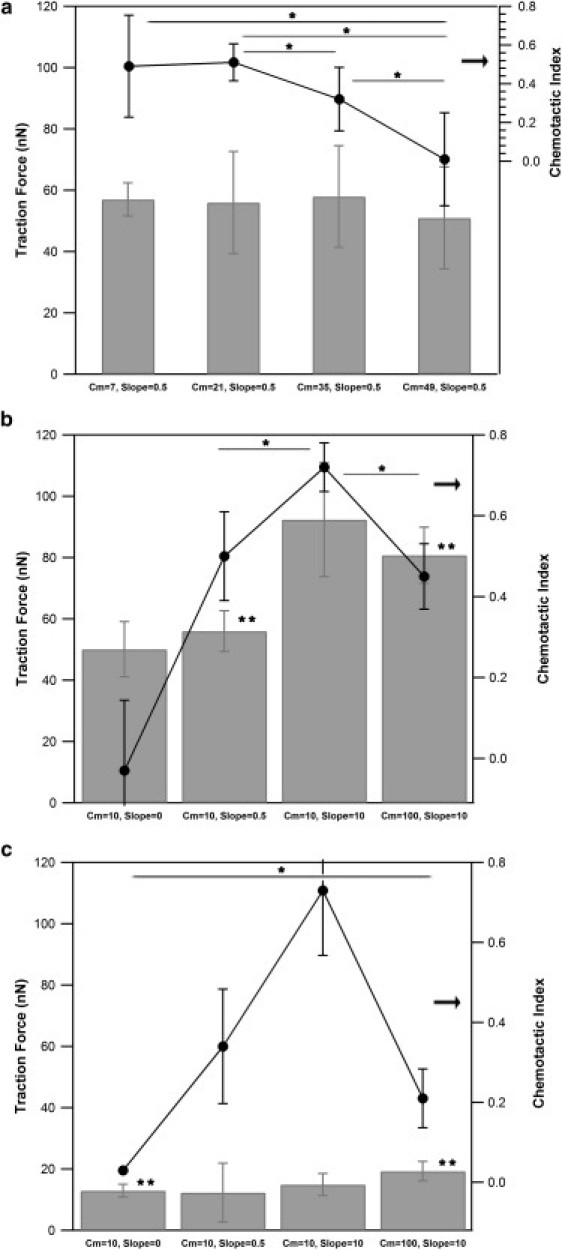
Traction force and chemotactic index of neutrophils in response to changes in mean fMLP concentration and gradient steepness. Average traction forces of neutrophils migrating in response to a range of mean fMLP concentrations and gradient slopes were measured and plotted with corresponding chemotactic indexes on stiff and soft hydrogels. (a and b) Measurements of neutrophils on a stiff gel (12 kPa) at varying mean fMLP concentrations and constant gradient of 0.5 nM/10 μm (a) and constant mean fMLP concentration and varying gradient slope (b). (c) Measurements of neutrophils on a soft gel (2 kPa) at constant mean fMLP concentration and varying gradient slope. Between 8 and 20 cells were measured for each chemotactic index value. Between 3 and 39 measurements were made for each traction force condition. Error bars represent 95% confidence intervals. ∗P < 0.05 for chemotaxis measurements; ∗∗P < 0.05 for traction force measurements.