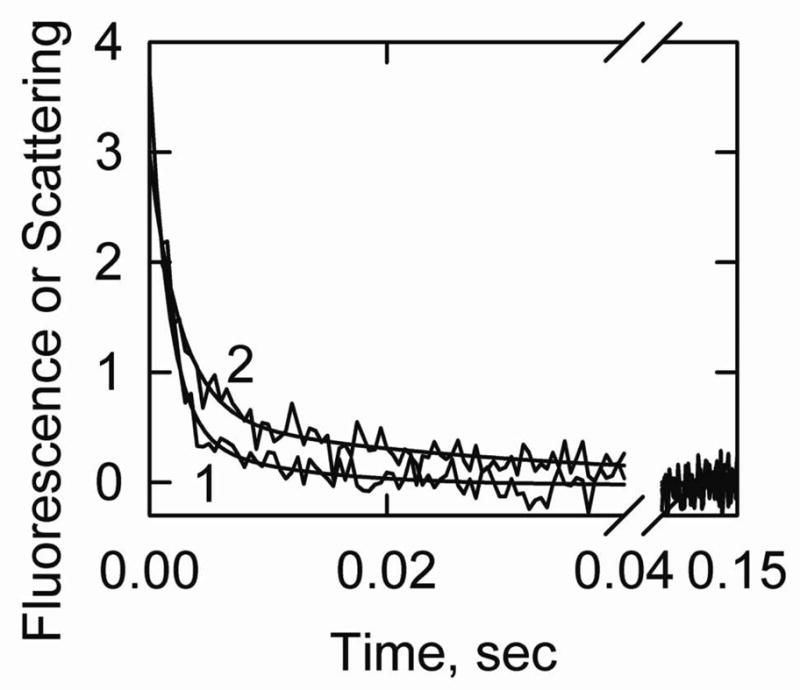
Figure 3.

S1-ATP dissociation experiment showing the transition from the active state to the intermediate state of actin-smooth muscle acrylodan tropomyosin. Final conditions: 2 μM actin, 0.86 μM acrylodan smooth muscle tropomyosin, 2 μM S1 at 5° C. The final buffer composition was 2 mM ATP, 6 mM MgCl2, 142 mM KCl, 20 mM MOPS, 2 mM EGTA and 1 mM dithiothreitol, pH 7.0. Curve 1: light scattering, kapp (major phase) = 640 s−1 and shown fit to Model A was with k3A = 700/sec. Curve 2: acrylodan fluorescence, kapp (major phase) = 400 s−1. The simulated curve was created with Model A with k3a = 700/sec and k5A = 600/sec. Reverse rate constants were assumed to be zero.
