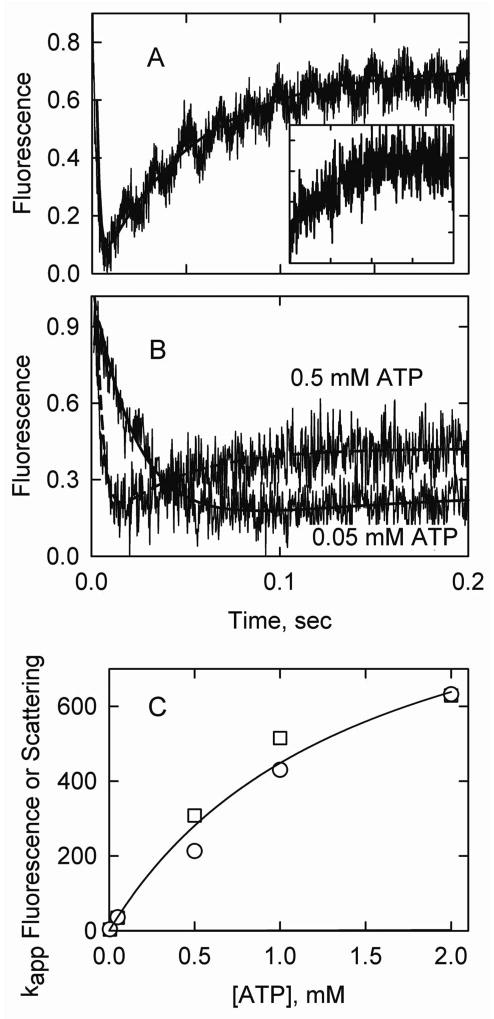
Figure 5.
S1-ATP dissociation experiments in the presence of caldesmon. Final conditions: 2 μM actin, 0.86 μM acrylodan smooth muscle tropomyosin, 0.86 μM caldesmon, 2 μM S1, 5° C and the same buffer as in Figure 3. Solid curves are fits to Model A. A. Acrylodan-tropomyosin fluorescence following S1-ATP detachment with k5A = 1560/sec and k7A + k8A =19/sec. An exponential fit gave kapp1 = 504/sec and kapp2 = 19/sec. The inset shows an S1-ATP dissociation experiment with 0.5 μM S1 with k5A = 2109/sec and k7A + k8A = 21/sec. B. Fluorescence transients for experiments with 0.5 mM and 0.05 mM ATP but with the ionic strength adjusted with KCl. For 0.5 mM ATP, k3A= 281/sec, k5A = 1030/sec, k7A + k8A = 25/sec. An exponential fit gave kapp1 = 237/sec and kapp2 =23/sec for 0.5 mM ATP and kapp = 43/sec for 0.05 mM ATP. C. Apparent rate constants (exponential fits) for light scattering (squares) and acrylodan fluorescence (circles) as a function of [ATP].

