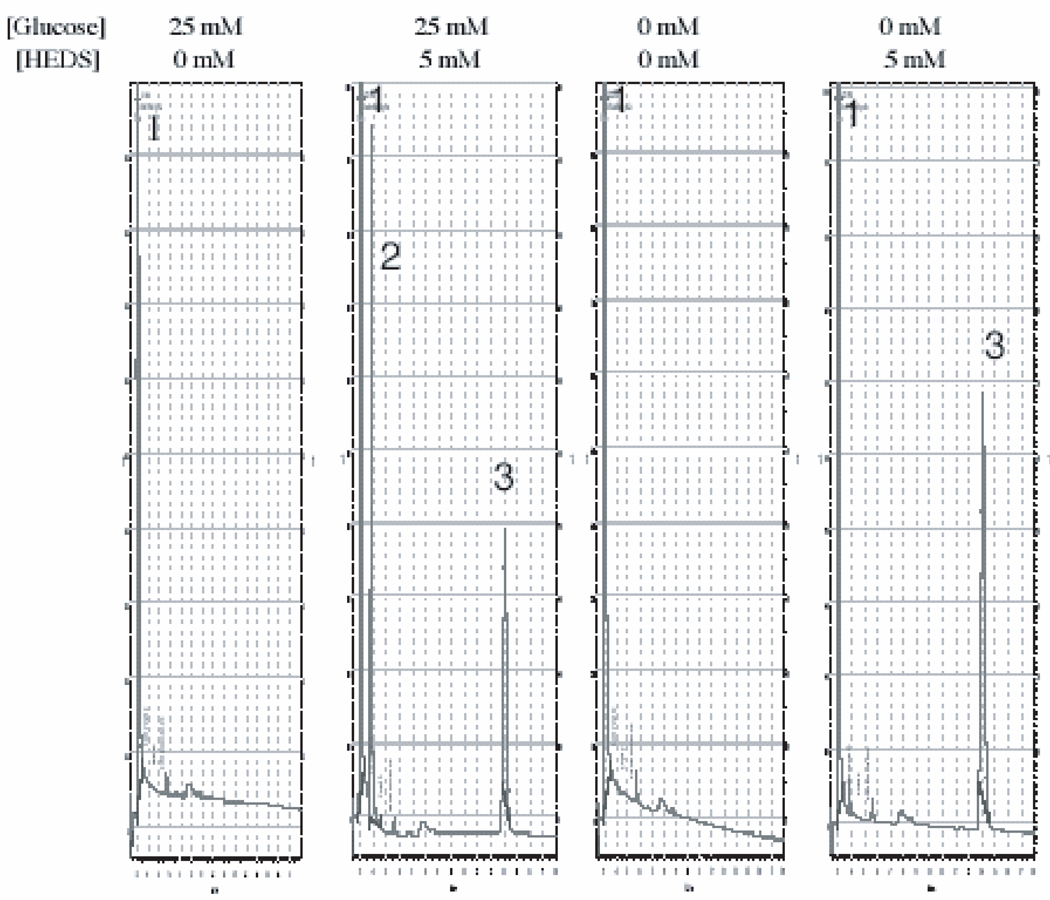
Figure 3.
A representative HPLC/EC separation of HEDS and ME demonstrating the specificity of medium based glucose dependent bioreductive assay determined by DTNB assay in Figure 2. (peaks 1-SSA; 2-ME; 3-HEDS). Each experiment was repeated at least three times. The area of the individual peak measured and normalized to standard ME by Agilent EZChrom Elite application was used to calculate the concentration of ME. The mercaptoethanol levels in glucose and glucose free medium are 1825±62 and 396±17µM respectively. Statistical comparisons for mercaptoethanol (ME) levels in glucose free medium relative to glucose medium was significant (P<0.0001).

