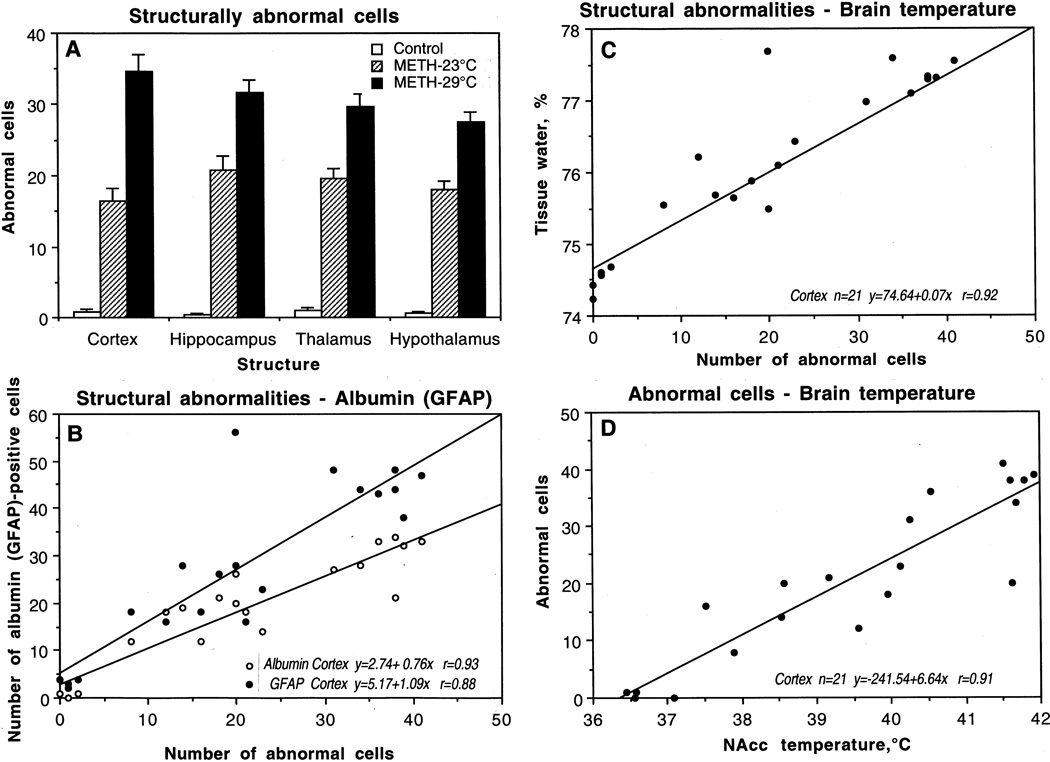
Fig. 7.
Mean (±sem) numbers of structurally abnormal cells in individual brain structures after saline (control) and methamphetamine administration at 23°C and 29°C (A). B shows correlative relationships between structural abnormalities and numbers of albumin- and GFAP-positive cells in the cortex. C shows correlative relationships between the numbers of abnormal cells and tissue water. D shows correlative relationships between the numbers of abnormal cells in the cortex and NAcc temperatures. Each graph shows regression equation, regression line, and correlation coefficient (r).

