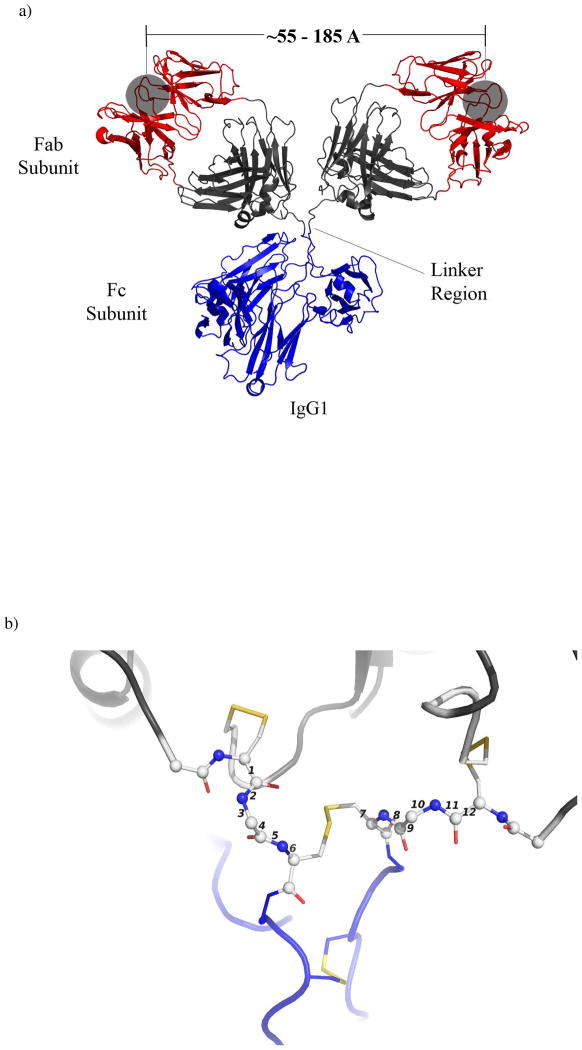
Figure 1.
A monoclonal murine IgG1 specific for phenolbarbital showing subunits and key distances (the ribbon diagram was generated using PyMol and the atomic coordinates: PDB 1IGY). a) The subunits are depicted by color – blue represents the Fc subunit, red and black represent the Fab, with the red ribbons depicting the binding pocket of the antibody (grey shaded region). The open circles designate the opening to the antigen binding sites. b) Expanded view of the linker region. Spheres represent atoms and sticks represent bonds between atoms. Disulfide bonds between Cys residues appear as yellow sticks. Numbers indicate the rotatable bonds.

