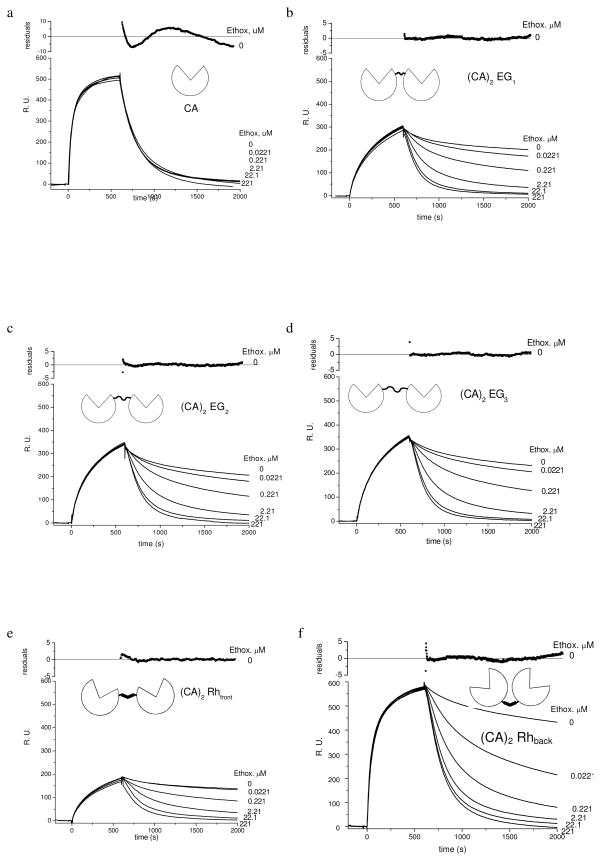
Figure 7.
Sensorgrams of HCAII(C206S, K133C) (438 nM) and (CA)2’s (219 nM) binding to SAMs presenting arylsulfonamides 2 (χ = 0.02) obtained with surface plasmon resonance (SPR). (CA)2EGn contain a flexible linker comprising ethylene-glycol and (CA)2Rhfront and (CA)2Rhback contain a rigid rhodamine linker. These sensorgrams show the three phases of each experiment: i) equilibration of the surface of the surface with buffer, ii) association of the protein with the surface, and iii) dissociation in the absence (0 μM) or the presence of ethoxzolamide (an inhibitor for CA, Kdethox = 0.0002 μM). These data have been corrected for changes in the bulk refractive index that occur due to protein in the solution that is not bound to the surface. The residuals for CA correspond to fitting a single exponential function (eq 11) to the sensorgrams with 0 μM of ethoxzolamide and show ~5% deviation of the model from the data. The residuals for (CA)2’s correspond to fitting a double exponential function (eq 12) to the sensorgrams with 0 μM and show < 5% deviation of the model from the data ethoxzolamide.

