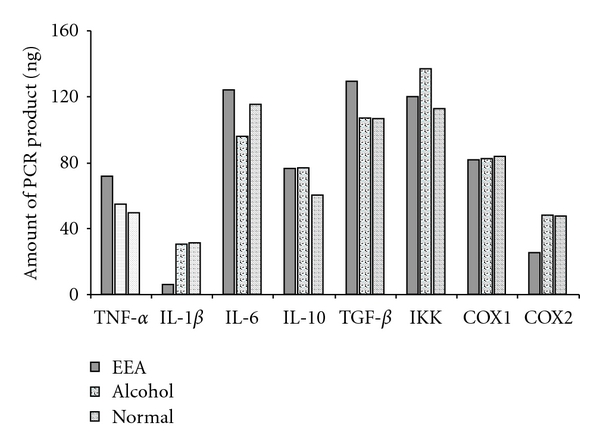
Figure 11.

Graphical presentation of quantification of the DNA bands presented in Figure 10 showing expression of the inflammation-related genes in T cells of DTH mice with and without EEA treatment, containing nine mice in each group. The DNA bands were quantified against 30 ng of lambda DNA through ImageAide, Spectronics Corporation, NY.
