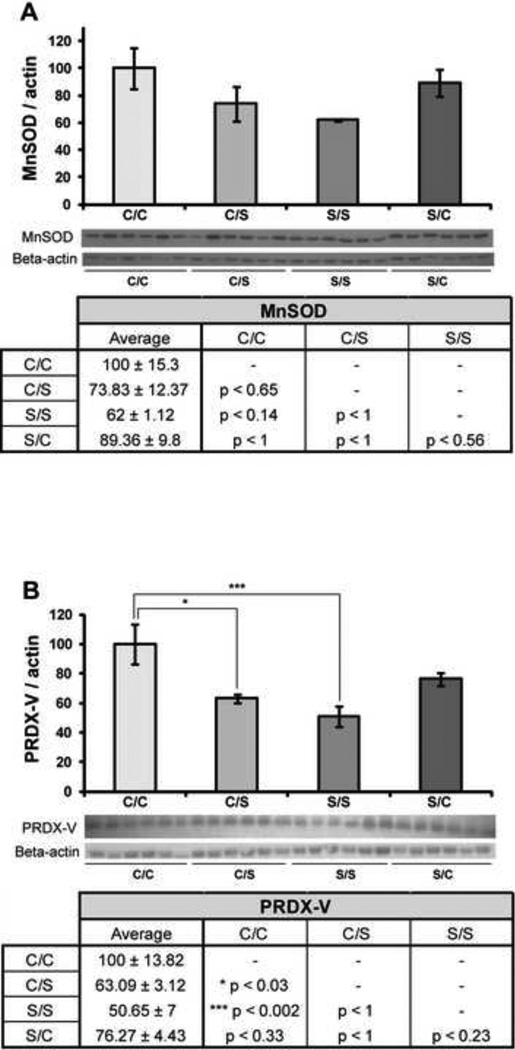
Figure 5. Effect of diet on mitochondrial antioxidant enzymes.
Western blot analysis of MnSOD (A) and PRDX-V (B) expression was performed on NHP hippocampal samples from each of the four diet paradigms. Expression levels for each sample were normalized to beta-actin levels. Expression levels were then normalized to the C/C diet (C/C was set to 100%). Statistically significant differences were calculated using a two-tailed, one-way analysis of variance (ANOVA), followed by a Bonferroni post-hoc correction. Diet paradigm significantly affected PRDX-V expression in the NHP hippocampus. Bars represent % C/C ± S.E.M., n = 6 for each condition, p<0.05*, p<0.01**, p<0.005***.

