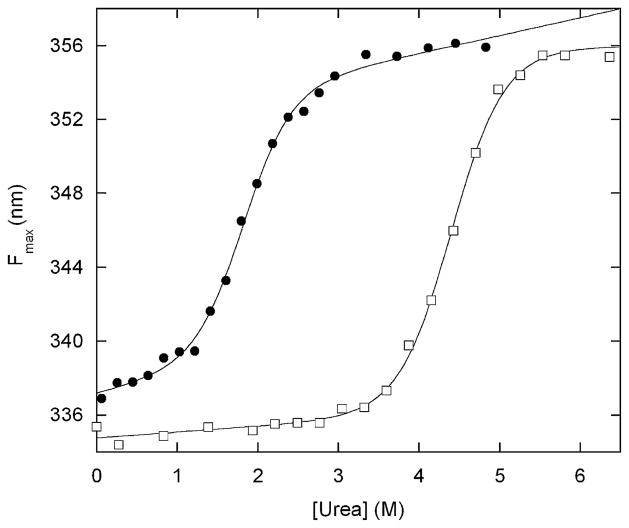
Figure 2.
Urea-induced denaturation of BG (filled circles) and free Bn (open squares) monitored by Trp fluorescence maximum. Lines are best fit of the data to the linear extrapolation equation. Solution conditions are 200 nM protein (monomer concentration), 25 mM Hepes (pH 7.0), 100 mM NaCl at 25 ºC. Data were collected on a Fluoromax-3 fluorometer (Jobin-Yvon/SPEX) with an excitation wavelength of 280 nm. Emission maxima were calculated using the Datamax software package (Jobin-Yvon/SPEX). BG was expressed in Escherichia coli BL21(DE3) and purified using the same protocol developed for barnase–ubiquitin.1 One notable difference is that BG is found completely in inclusion bodies and is thus protected from proteolysis; the yield of BG is correspondingly much higher than that of barnase–ubiquitin.

